Twenty years of financials, live valuation models, every congressional and insider filing, and a forum where people show their work. One ticker gets you all of it.
Everything you research,
in one place.
Stocks, funds, valuations, portfolios, congressional trades and the community that argues about them — pick a category to see it live.
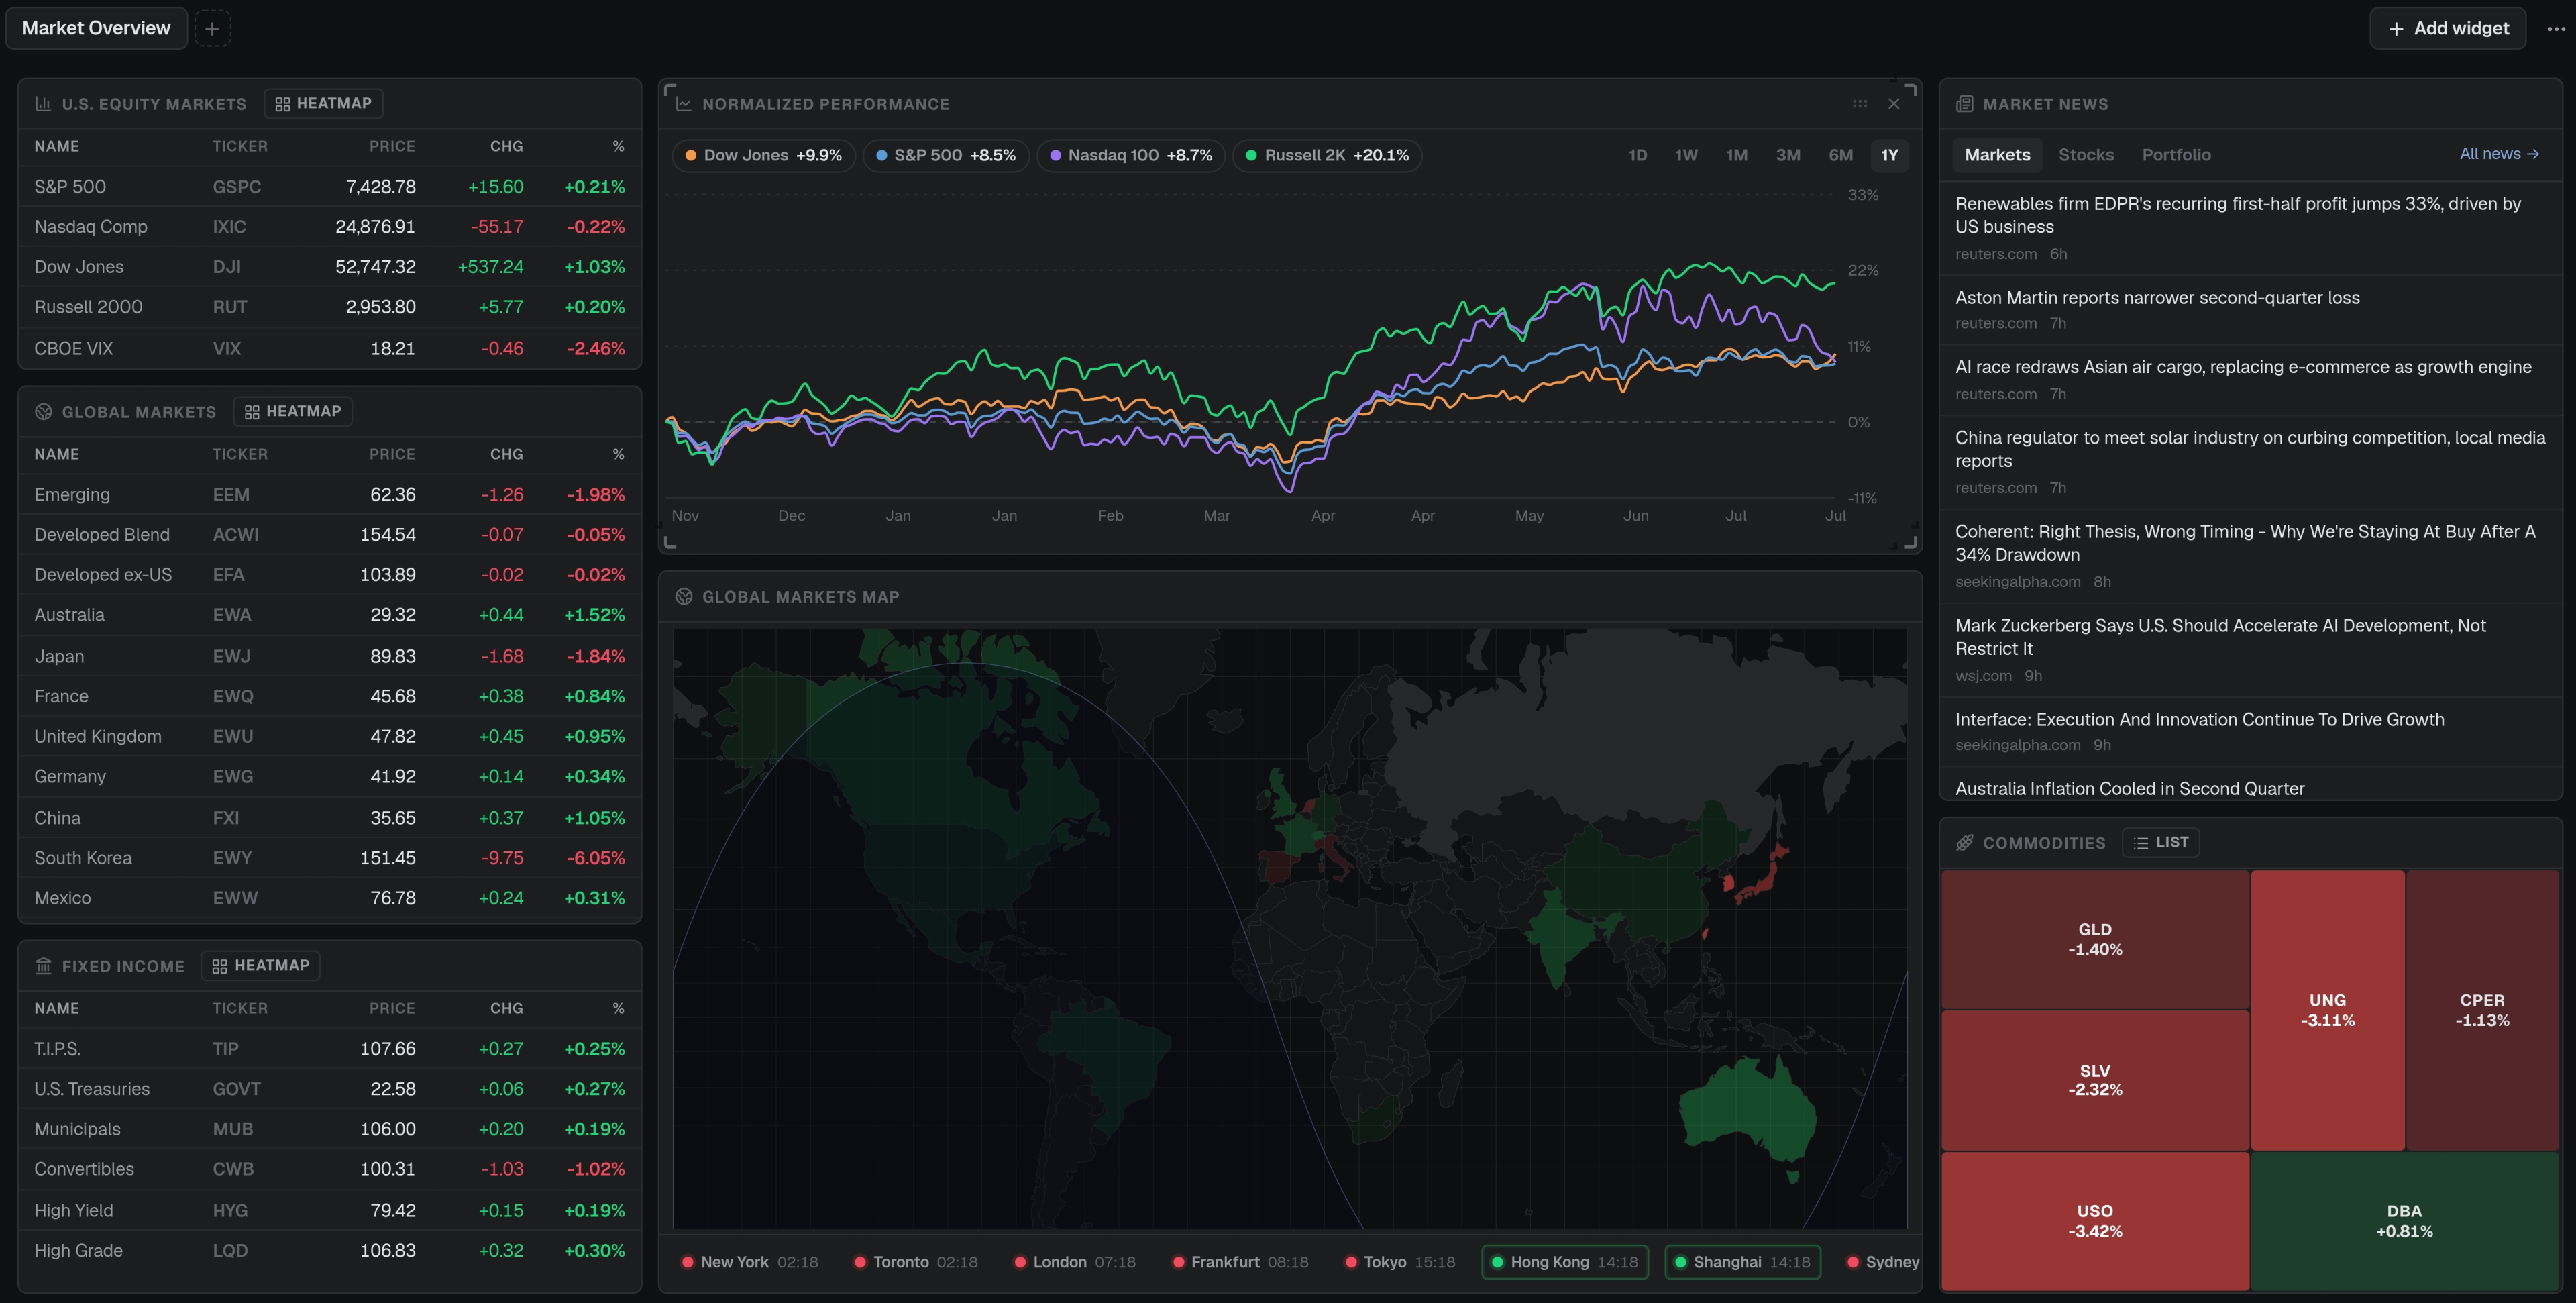
One customizable board for your whole workflow
A drag-and-drop grid of widgets — markets, watchlists, portfolio movers, news, macro maps and heatmaps. Pin what you check every morning; hide what you don't.
- Fully customizable widget grid, rearrange with a drag
- Markets, portfolio, watchlist, news and macro in one view
- Presets for beginners, full control for power users
Built by investors,
for investors.
We got tired of choosing between toy apps and $25,000 terminals. FinanceProbe is the middle that should have always existed.
Institutional-grade data
10,000+ tickers with 20+ years of statements, ratios and estimates — the depth of a Bloomberg terminal without the six-figure seat.

Built for speed
From ticker to chart to valuation in seconds. No tab sprawl, no CSV wrangling — every workflow lives in one keyboard-friendly workspace.

Priced for humans
Free forever for core research and every valuation model. Premium unlocks broker sync and deep exports at the price of two coffees a month.
One workspace, every kind of investor.
Own your process
Stop outsourcing conviction. Research companies, build your own fair-value estimates and track how your actual portfolio performs against them.
- Broker sync across accounts
- Watchlists and alerts
- DCFs pre-filled from real data
Compress the busywork
Pull 20 years of financials into Excel in one click, compare fundamentals across a peer set, and share read-only models with your team or clients.
- 20+ year Excel exports
- Peer comparison tables
- Shareable model links
Learn on real numbers
Build your first DCF on live company data, follow how congressional and insider money moves, and pressure-test ideas with a community that shows its work.
- Interactive valuation models
- Congress & insider feeds
- A forum with receipts
Simple, honest pricing.
Start free, upgrade when the tools pay for themselves. 15-day free trial on Premium — cancel anytime.
Free
Everything you need to start researching.
- Full company search & fundamentals
- Up to 5 years of financial data
- Valuation models — DCF, DDM & Industry Comps
- Shareable valuation models with OG previews
- Forum + congressional trades feed
- Manual portfolio upload (one)
- Save up to 3 valuation scenarios
- AI assistant — 10 messages/day
Premium Plan
Or $49.99/year — 15-day free trial.
- Deep financial history — 20+ year Excel exports
- Unlimited saved valuation scenarios
- Live portfolio and trade sync across brokers
- Multiple portfolios with share links
- AI assistant — 150 messages/day
Start researching
like you mean it.
Free forever for core research. Two minutes to your first chart.
Sign up for free